Reports
A ready breakdown for the period: response funnel, topics, incoming themes — with formulas and PDF printing.
Section in the service: /analytics/reports
The section has two kinds of reports, and it's important not to confuse them.
- Computed: response funnel, topic performance, channel breakdown, incoming themes. Everything comes from your own metrics, drawn as widgets and printed.
- Frameworks — SWOT, CJM, JTBD and the like. They're ways of thinking, not metrics, so the section builds a ready request with the workspace's numbers filled in, and the conclusions are written by your assistant.
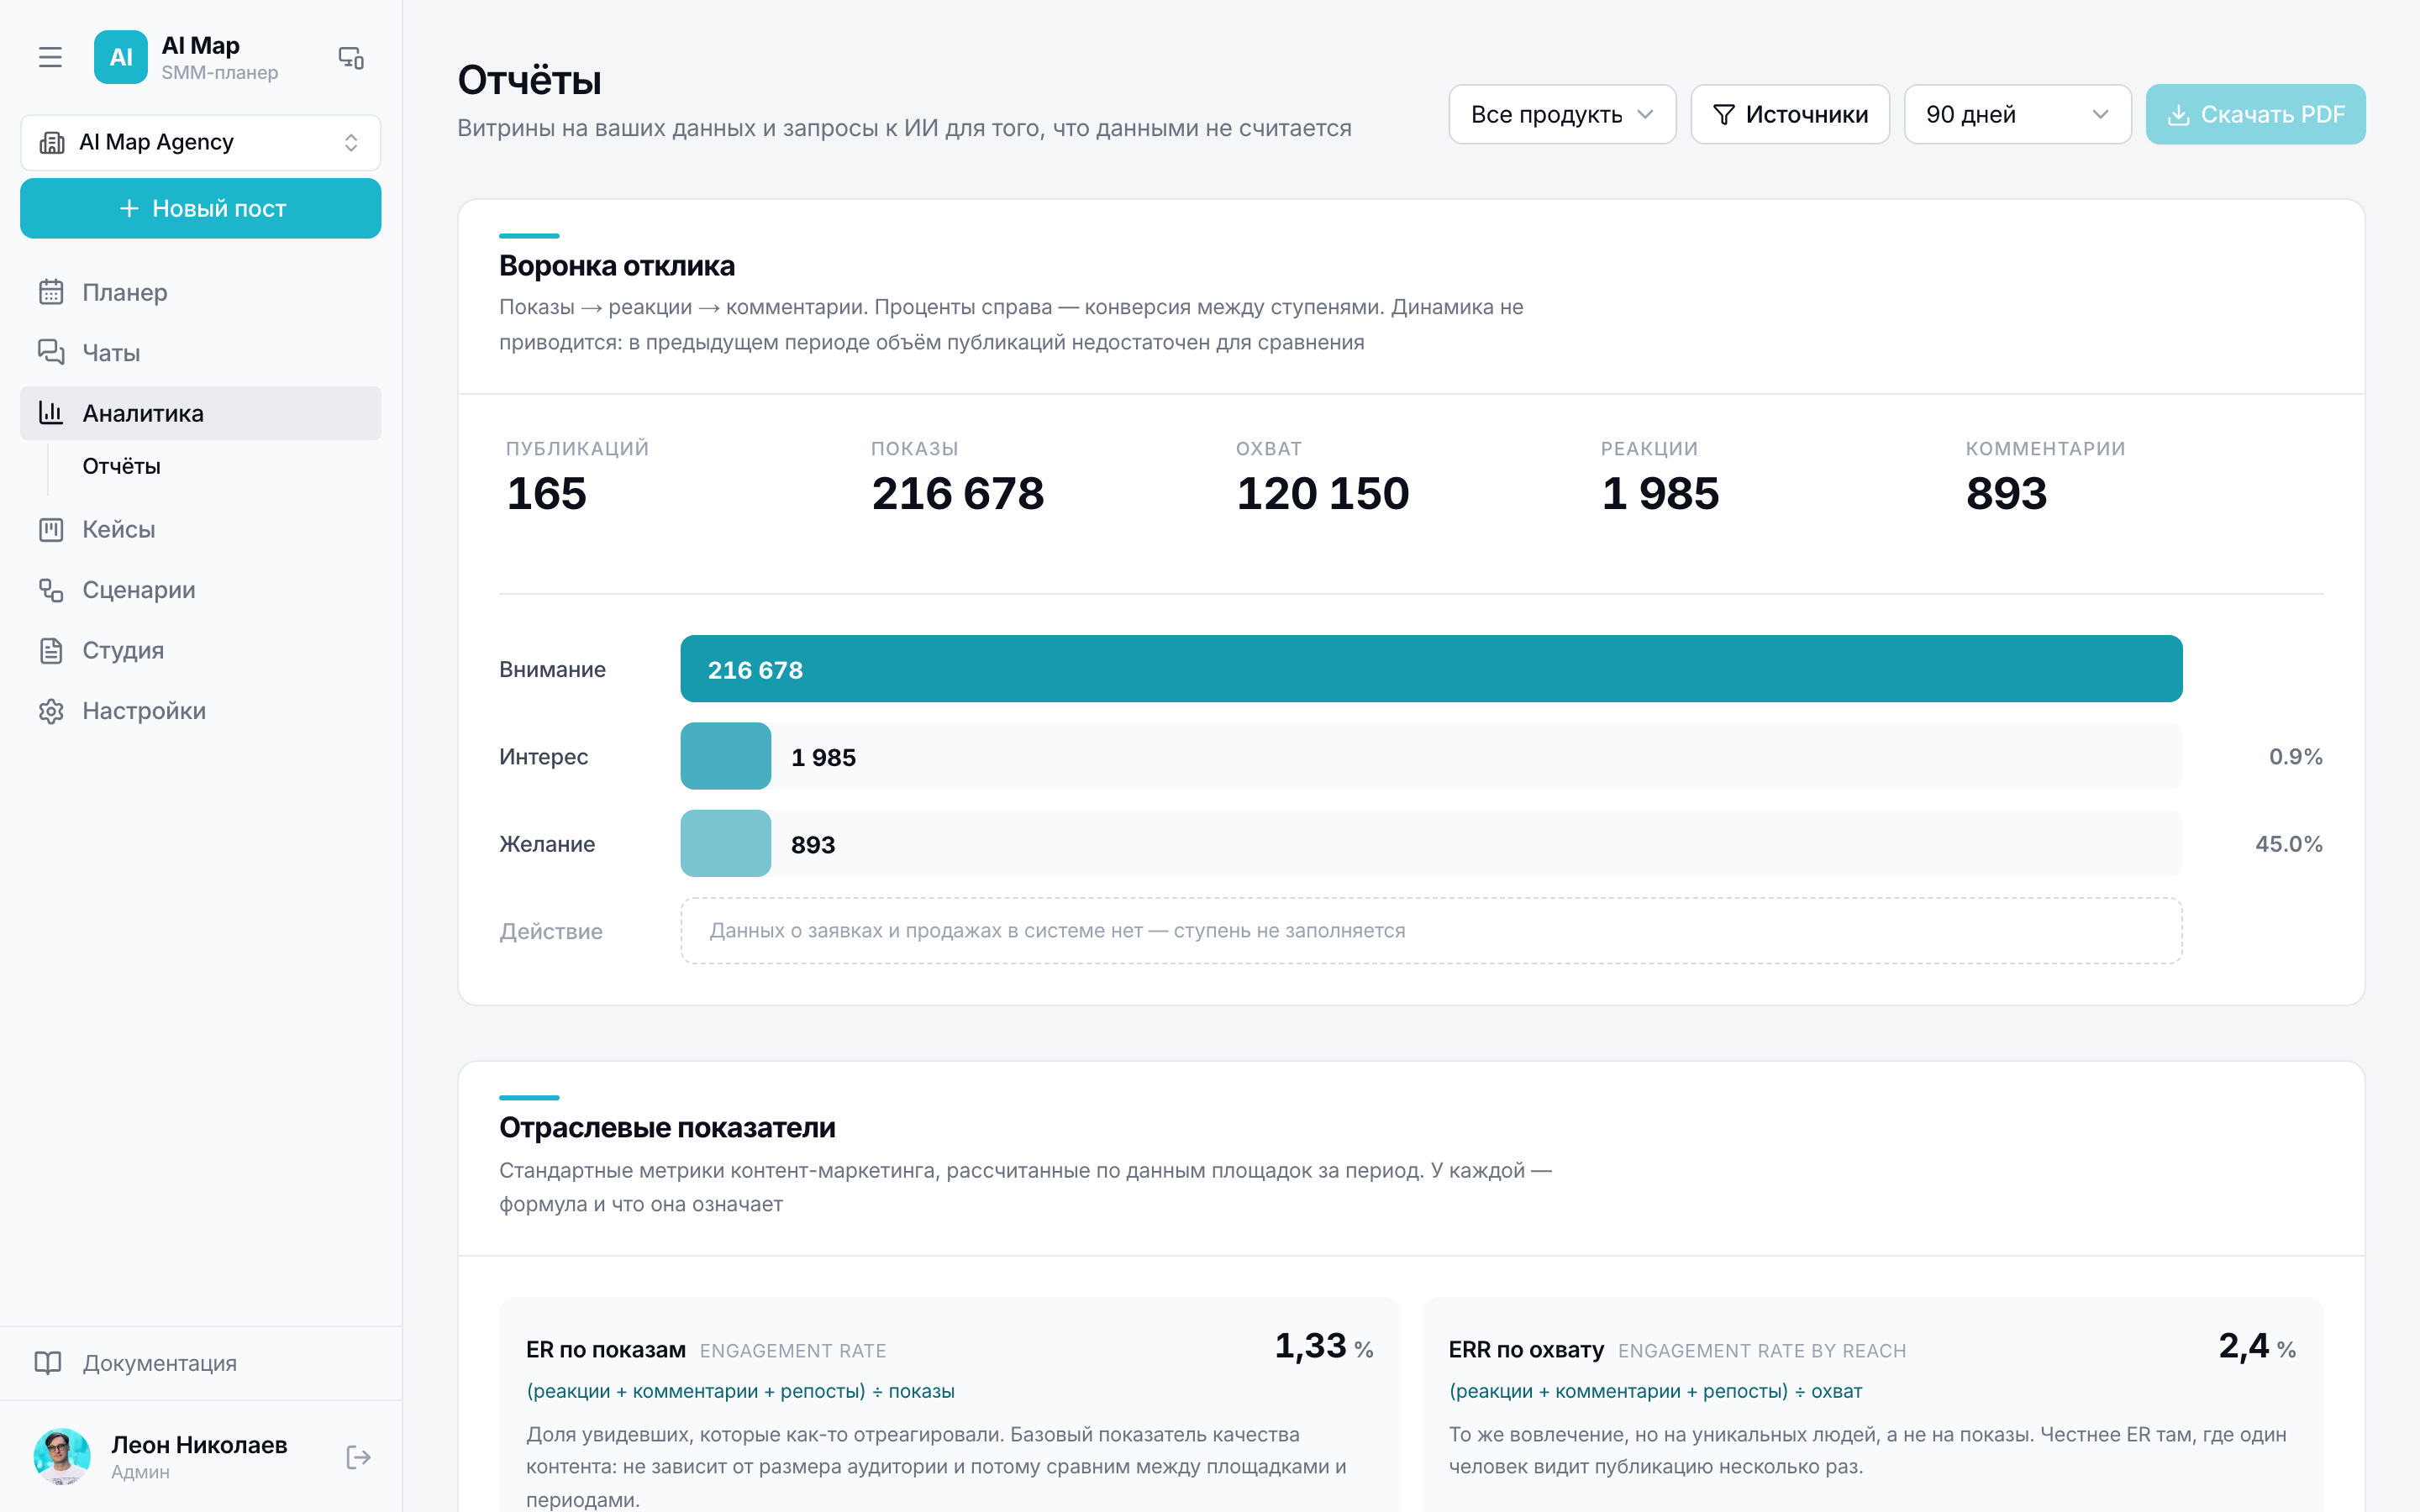
Formulas in plain sight
Each metric says what it's calculated from: ER by impressions, ERR by reach, discussion share, amplification rate. The report is read not only by the one who built it, so the explanation goes next to the number.
Business context
What the company does, whom it sells to, how sales work — this knowledge isn't derived from metrics. It's stored separately and inserted into requests to the assistant so it doesn't ask the same thing every time.
Printing to PDF
The report is laid out as a document: it can be printed or saved as PDF right from the browser — with backgrounds preserved and page breaks.
What's not in the report
Money: CAC, LTV, ROMI and cost per contact. The system has neither spend nor deals, and made-up numbers are worse than none. When the data appears, so will the section.