Analytics
Where the numbers come from, how “received per day” differs from “by publish date” and how to read the breakdowns.
Section in the service: /analytics
Analytics is calculated from the same table of posts as the calendar. So the sections always agree: if a post got into the plan, it gets into the statistics too, and vice versa.
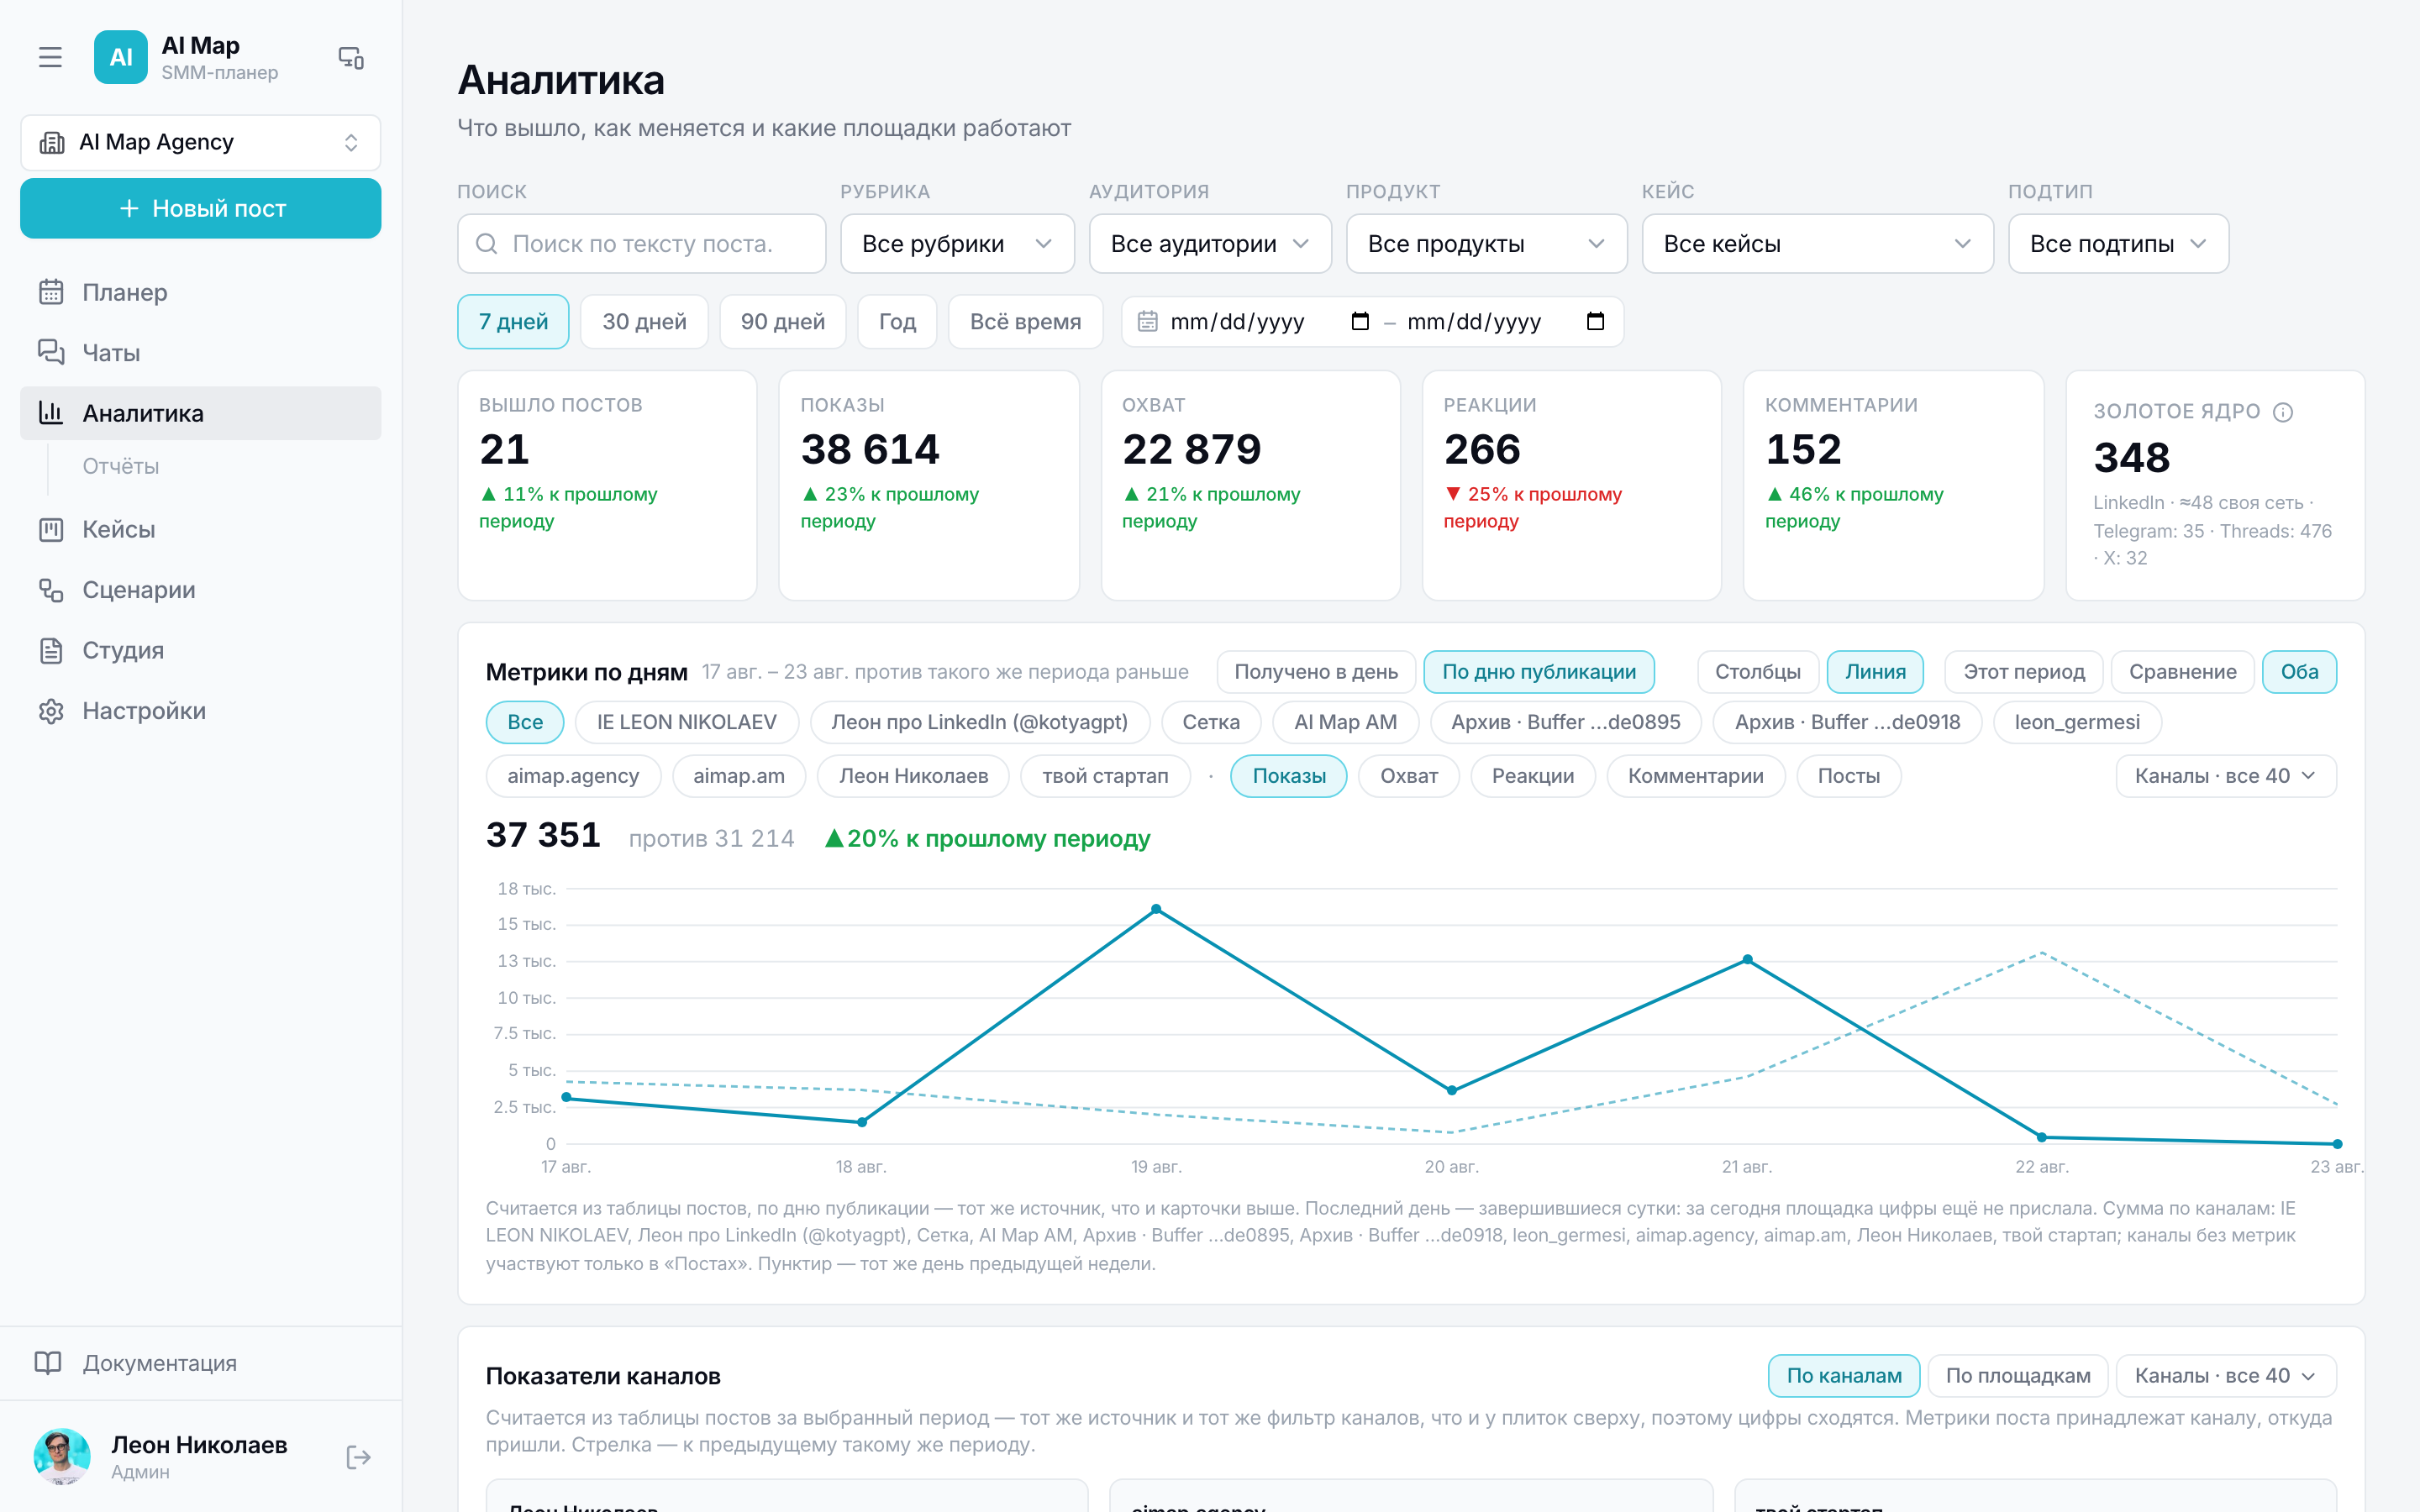
What the metrics mean
- Impressions — how many times the publication was shown. Platforms call it impressions or views: the same thing under different names, not added up within one channel.
- Reach — how many unique people saw it. Only the platforms' official APIs give it, that is Zernio.
- Reactions and comments — as the platform has them.
- Golden core — how many people consistently see your posts in the first 24 hours.
Two ways to look at days
- “Received per day” — how many impressions came on a specific day across all the profile's posts. That's how LinkedIn itself counts, and this is the number you compare your figures to.
- “By publish date” — how much the posts that went out on that day collected. That's how you see which day gave the result.
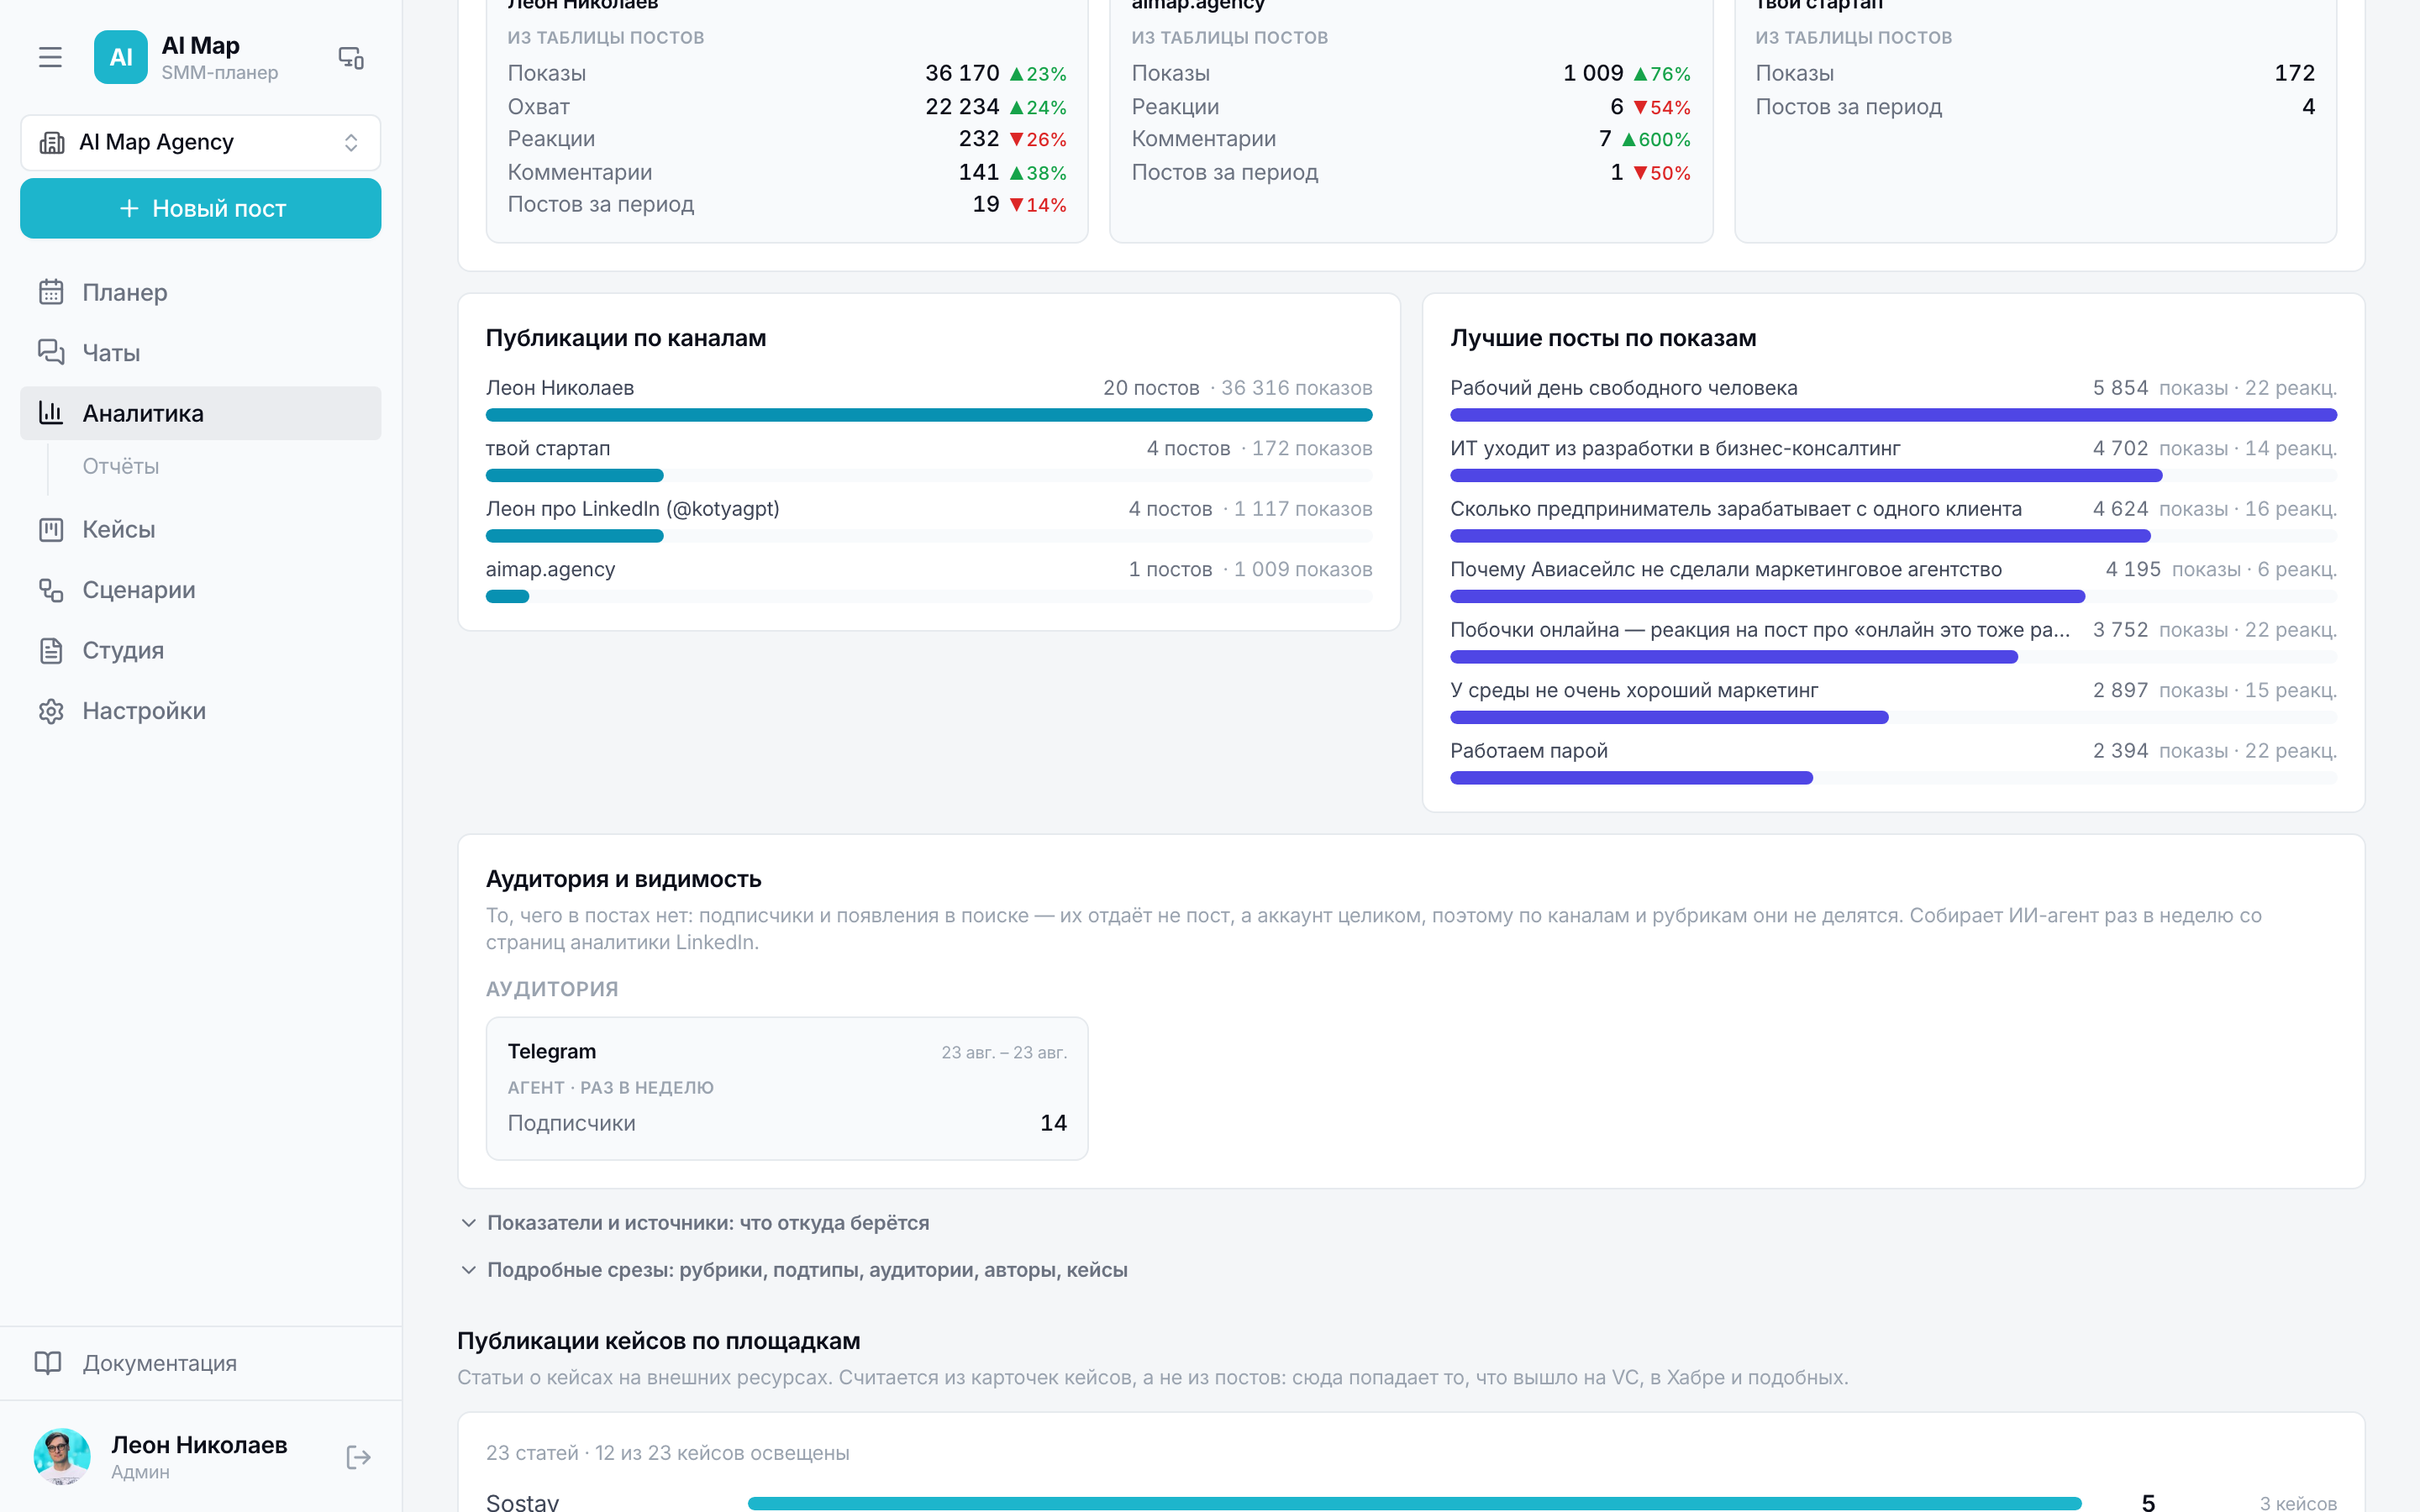
The first way relies on hourly snapshots, the second on the table of posts. The difference between them is normal: they're different questions, not a data mismatch.
Periods and filters
At the top — presets from 7 days to all time and a custom range field: set two dates and the whole section recalculates for them, including the comparison with the previous period of the same length.
The channel filter applies to both the tiles and the charts. If something is hidden, a line under the table says how many channels and impressions were removed from the page.
Channels or platforms
Metrics can be viewed by channel (each account separately) or by platform (everything related to LinkedIn, to Telegram and so on). It's a switch, not different data: one account connected via two routes is counted once in both modes.
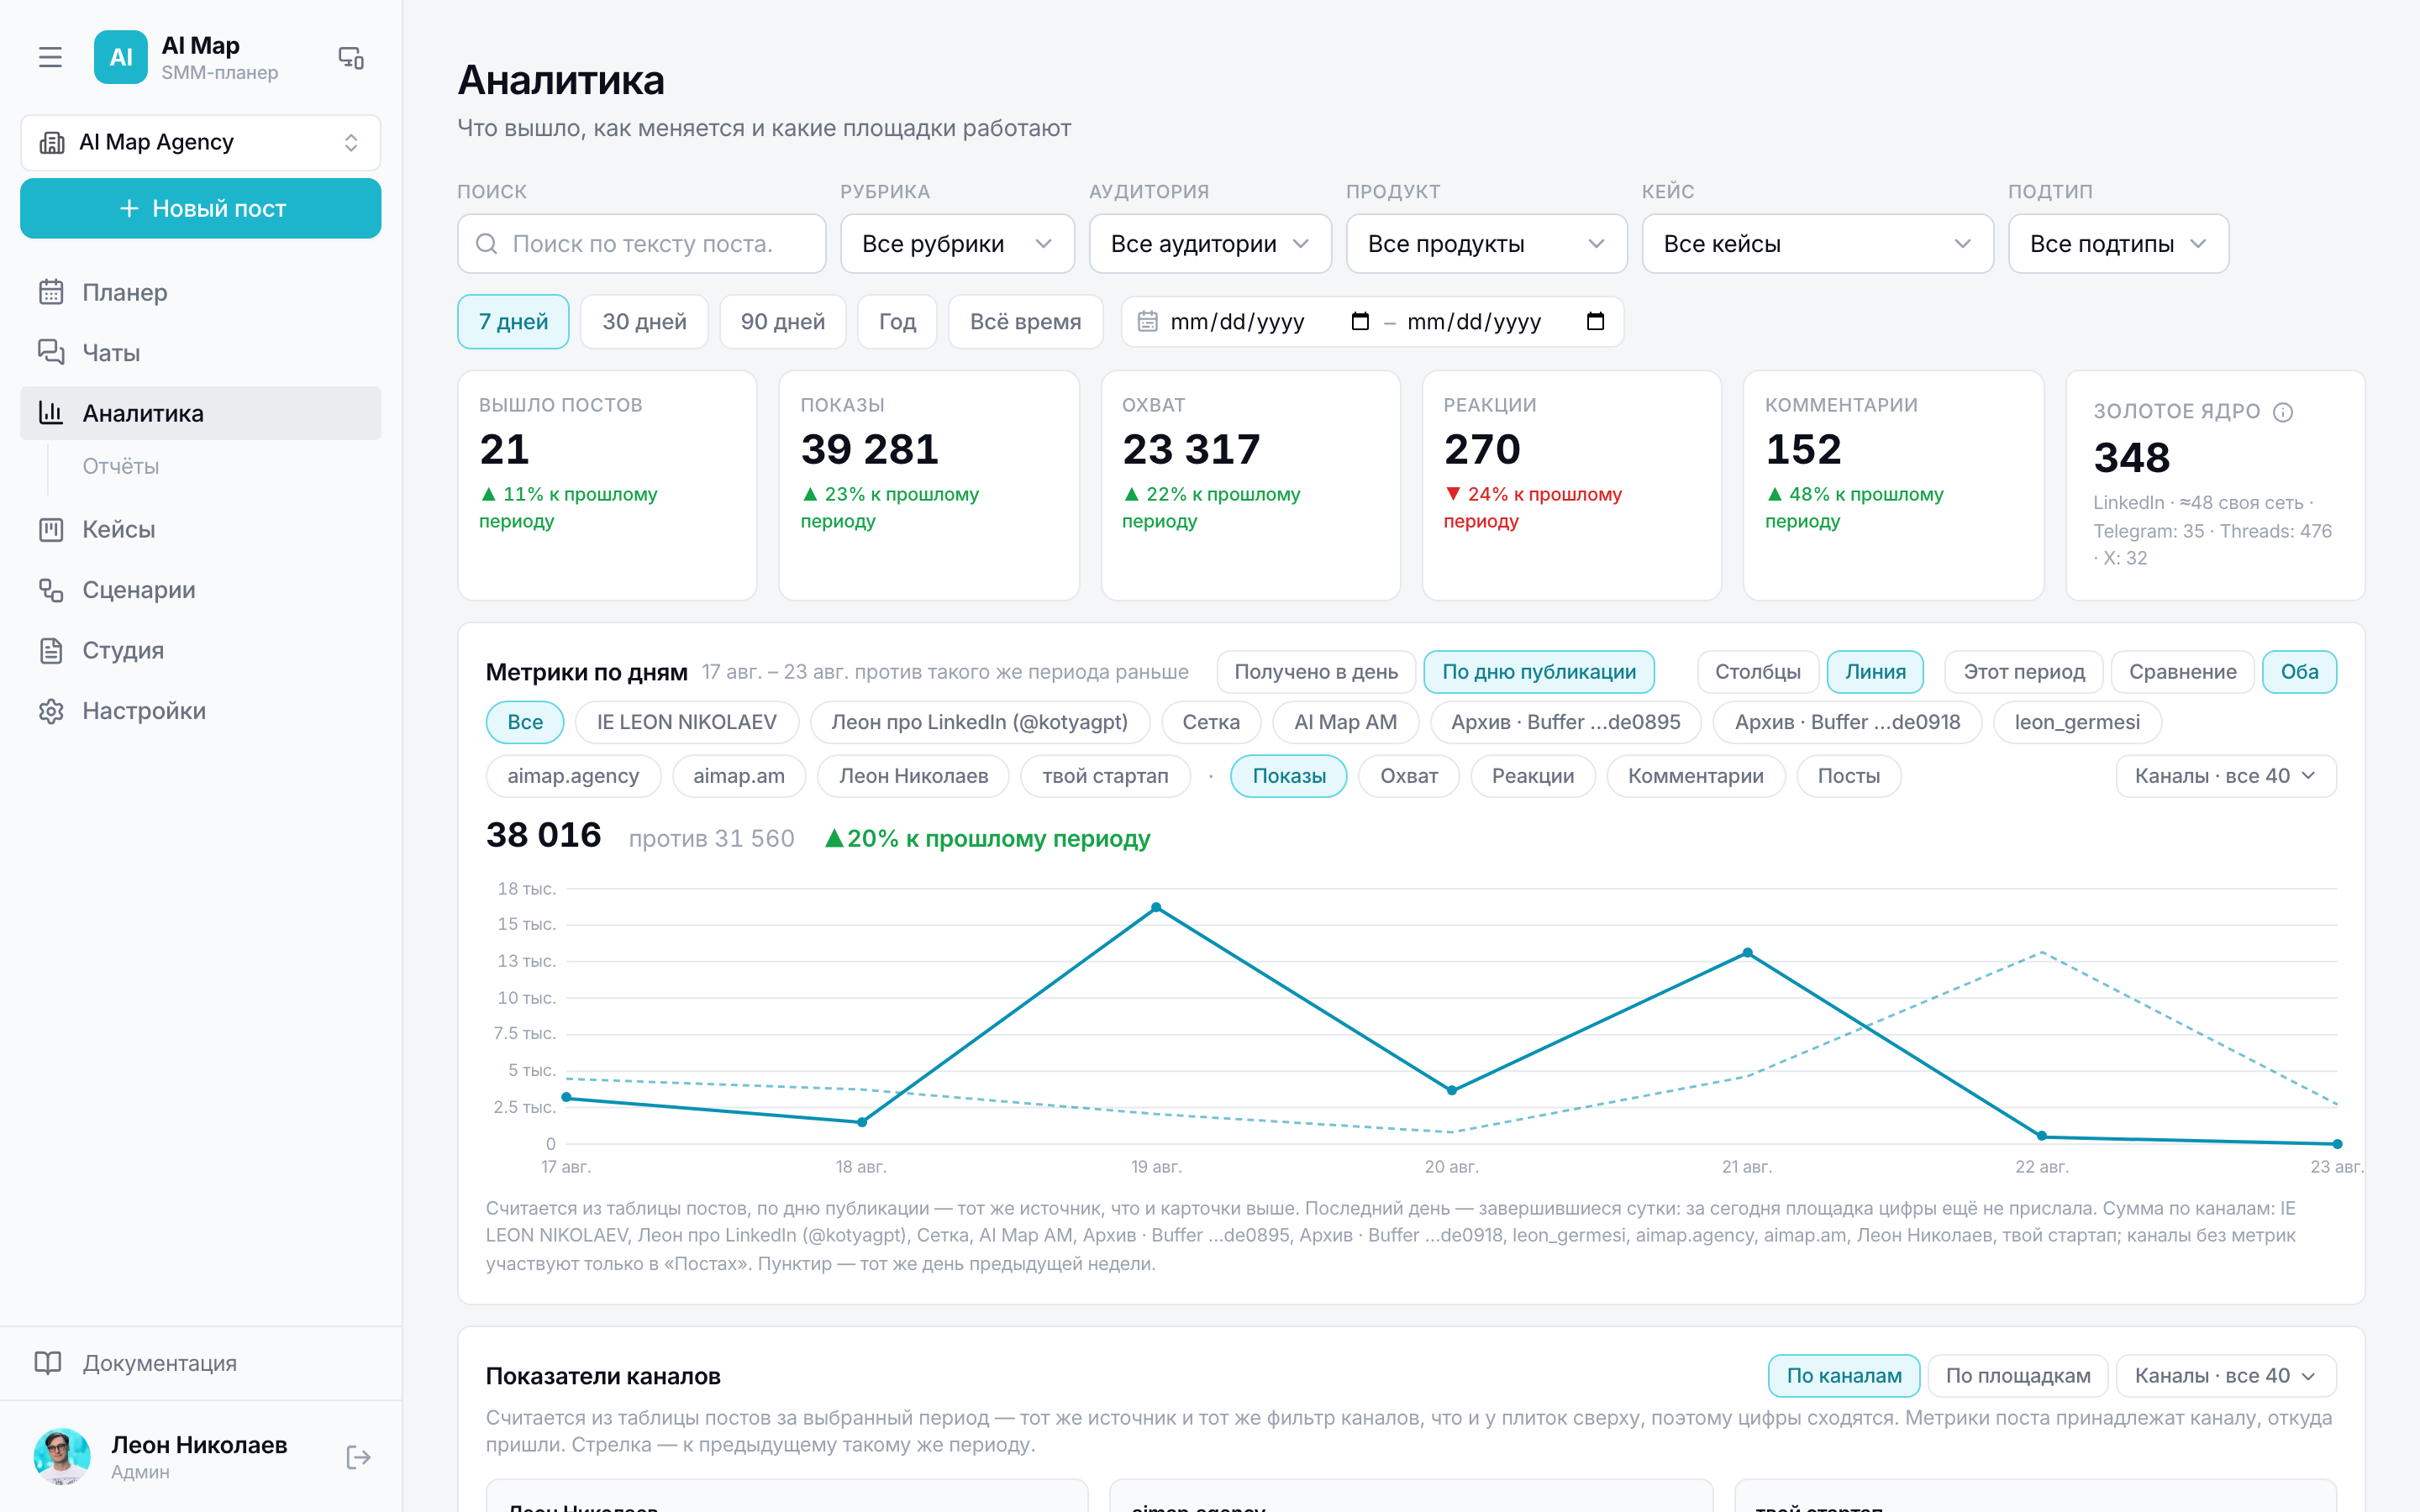
Where it's taken from
Each metric shows its origin: collected automatically, taken from the public page or entered by hand. A separate “Sources” tab shows what each platform returns at all and with what limitations.
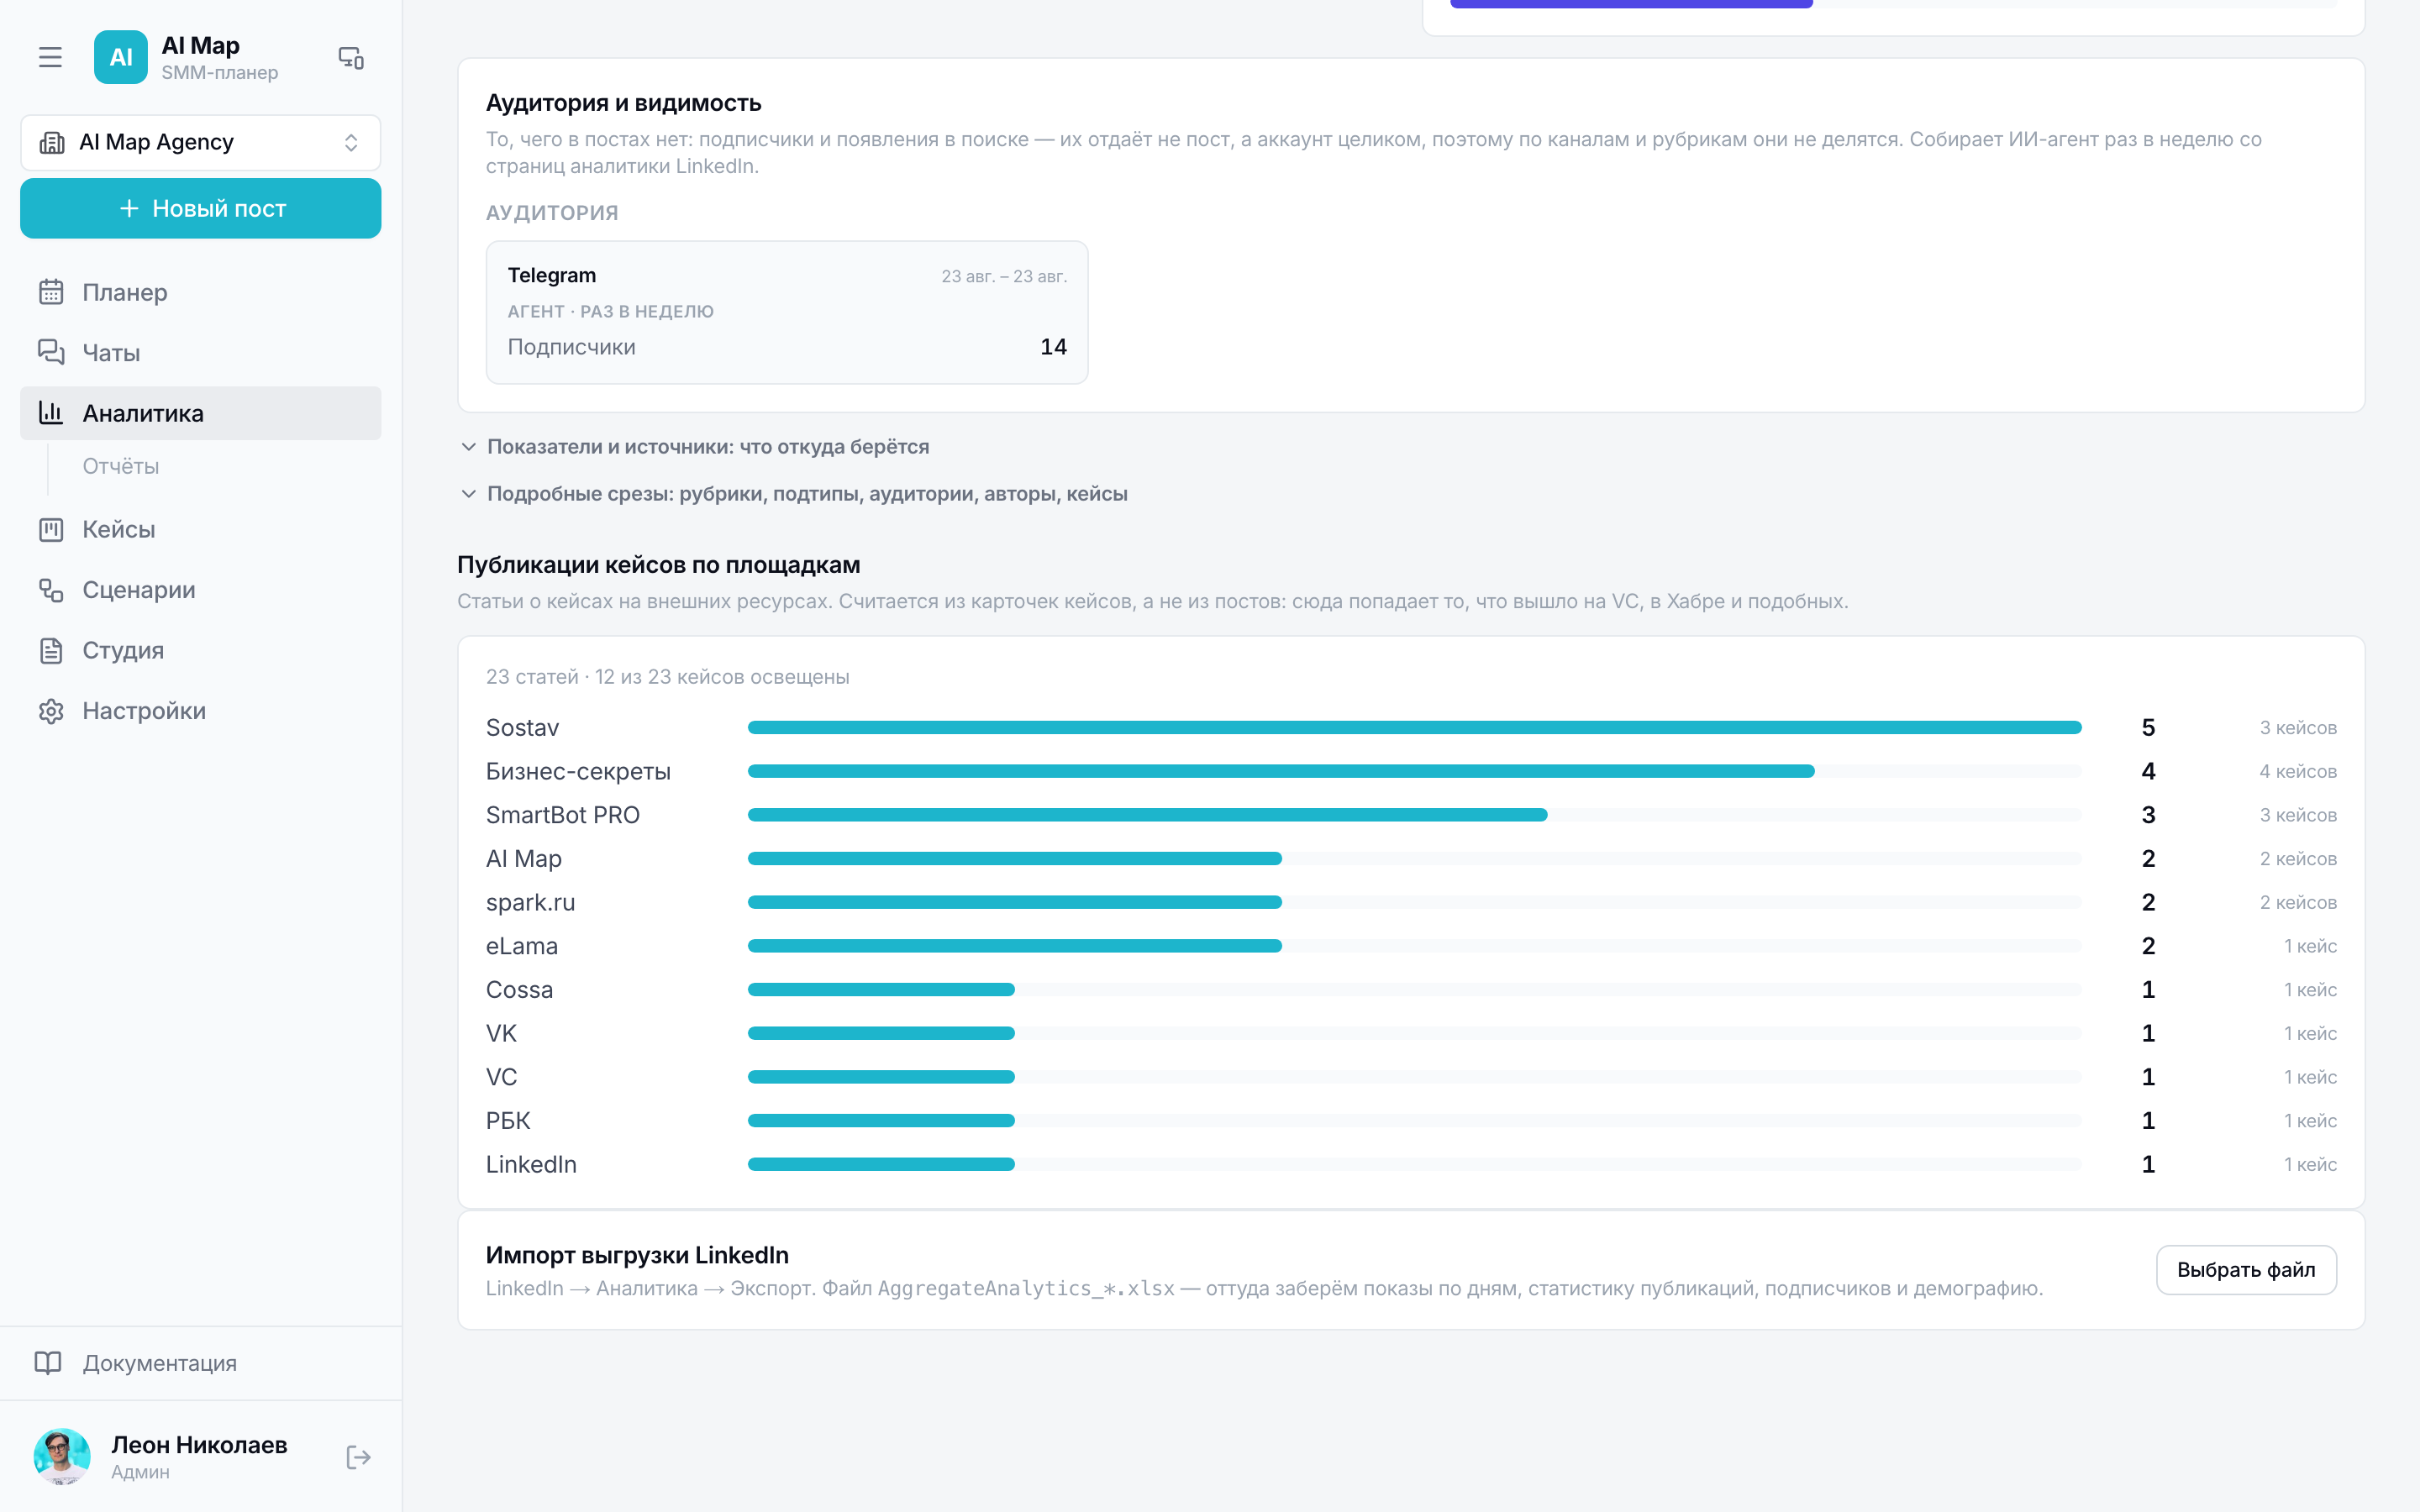
Only real manual numbers are accepted — a made-up figure spoils the whole section and surfaces later in the report.