Chat analytics
How many write, who replies — bot or people, how fast, and what's in the funnel: from comment to deal.
Section in the service: chats.aimap.agency/analytics
Chat analytics is calculated from your message database, not from platform reports, so it has what platforms don't know: the median reply wait, the share of bot replies, a person's path from first comment to deal. Periods — 7, 30, 90 days and a year; each number is shown with a delta vs the same period before.
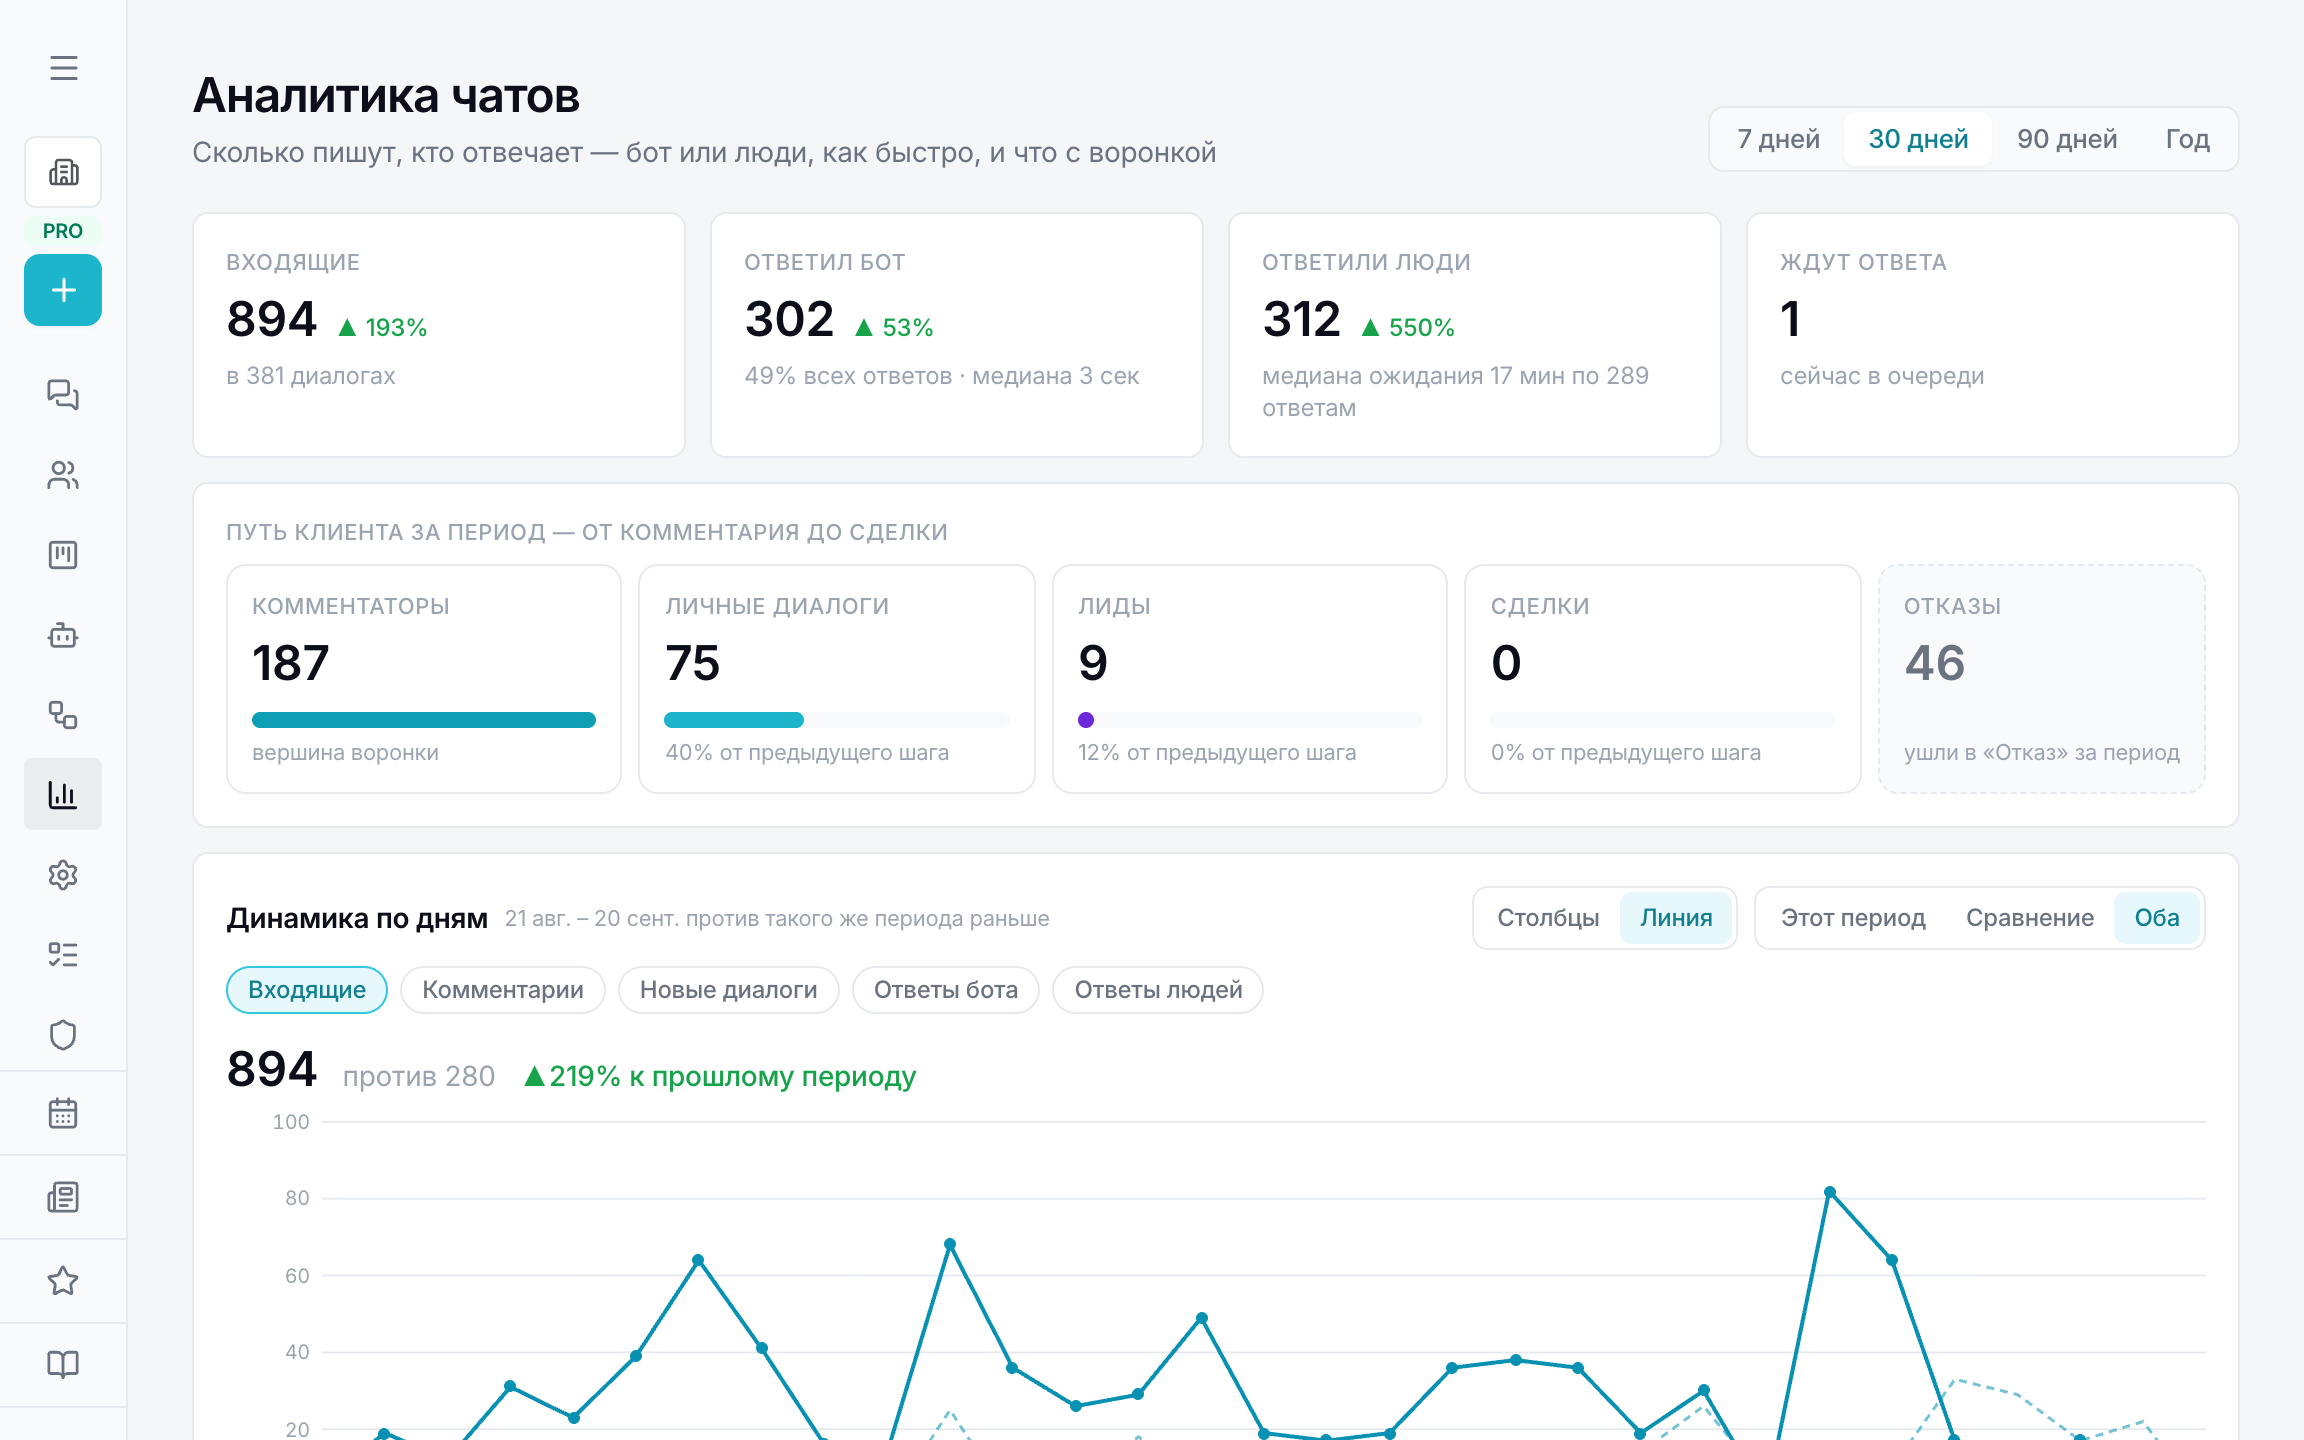
What's on the screen
- Incoming, bot replied (share and median), people replied (median wait), awaiting reply now.
- The customer path for the period: commenters → direct conversations → leads → deals, lost separately. Percentages are counted from the previous step.
- Daily dynamics — the same chart as “Metrics by day” in SMM: metric chips (incoming, comments, new conversations, bot replies, human replies, leads), bars or line, comparison with the previous period as a dashed line.
- The funnel by CRM status with moves in the period — you can see not only where cards sit, but where they moved.
- New conversations by source (social / bots) and platform; tags set by bots.
- Table by platform: incoming, comments, DMs, bot replied, people replied, waiting.
- Bots over the period — each of your bots and AI agents as a row: conversations, incoming, replies, leads, action calls, model failures.
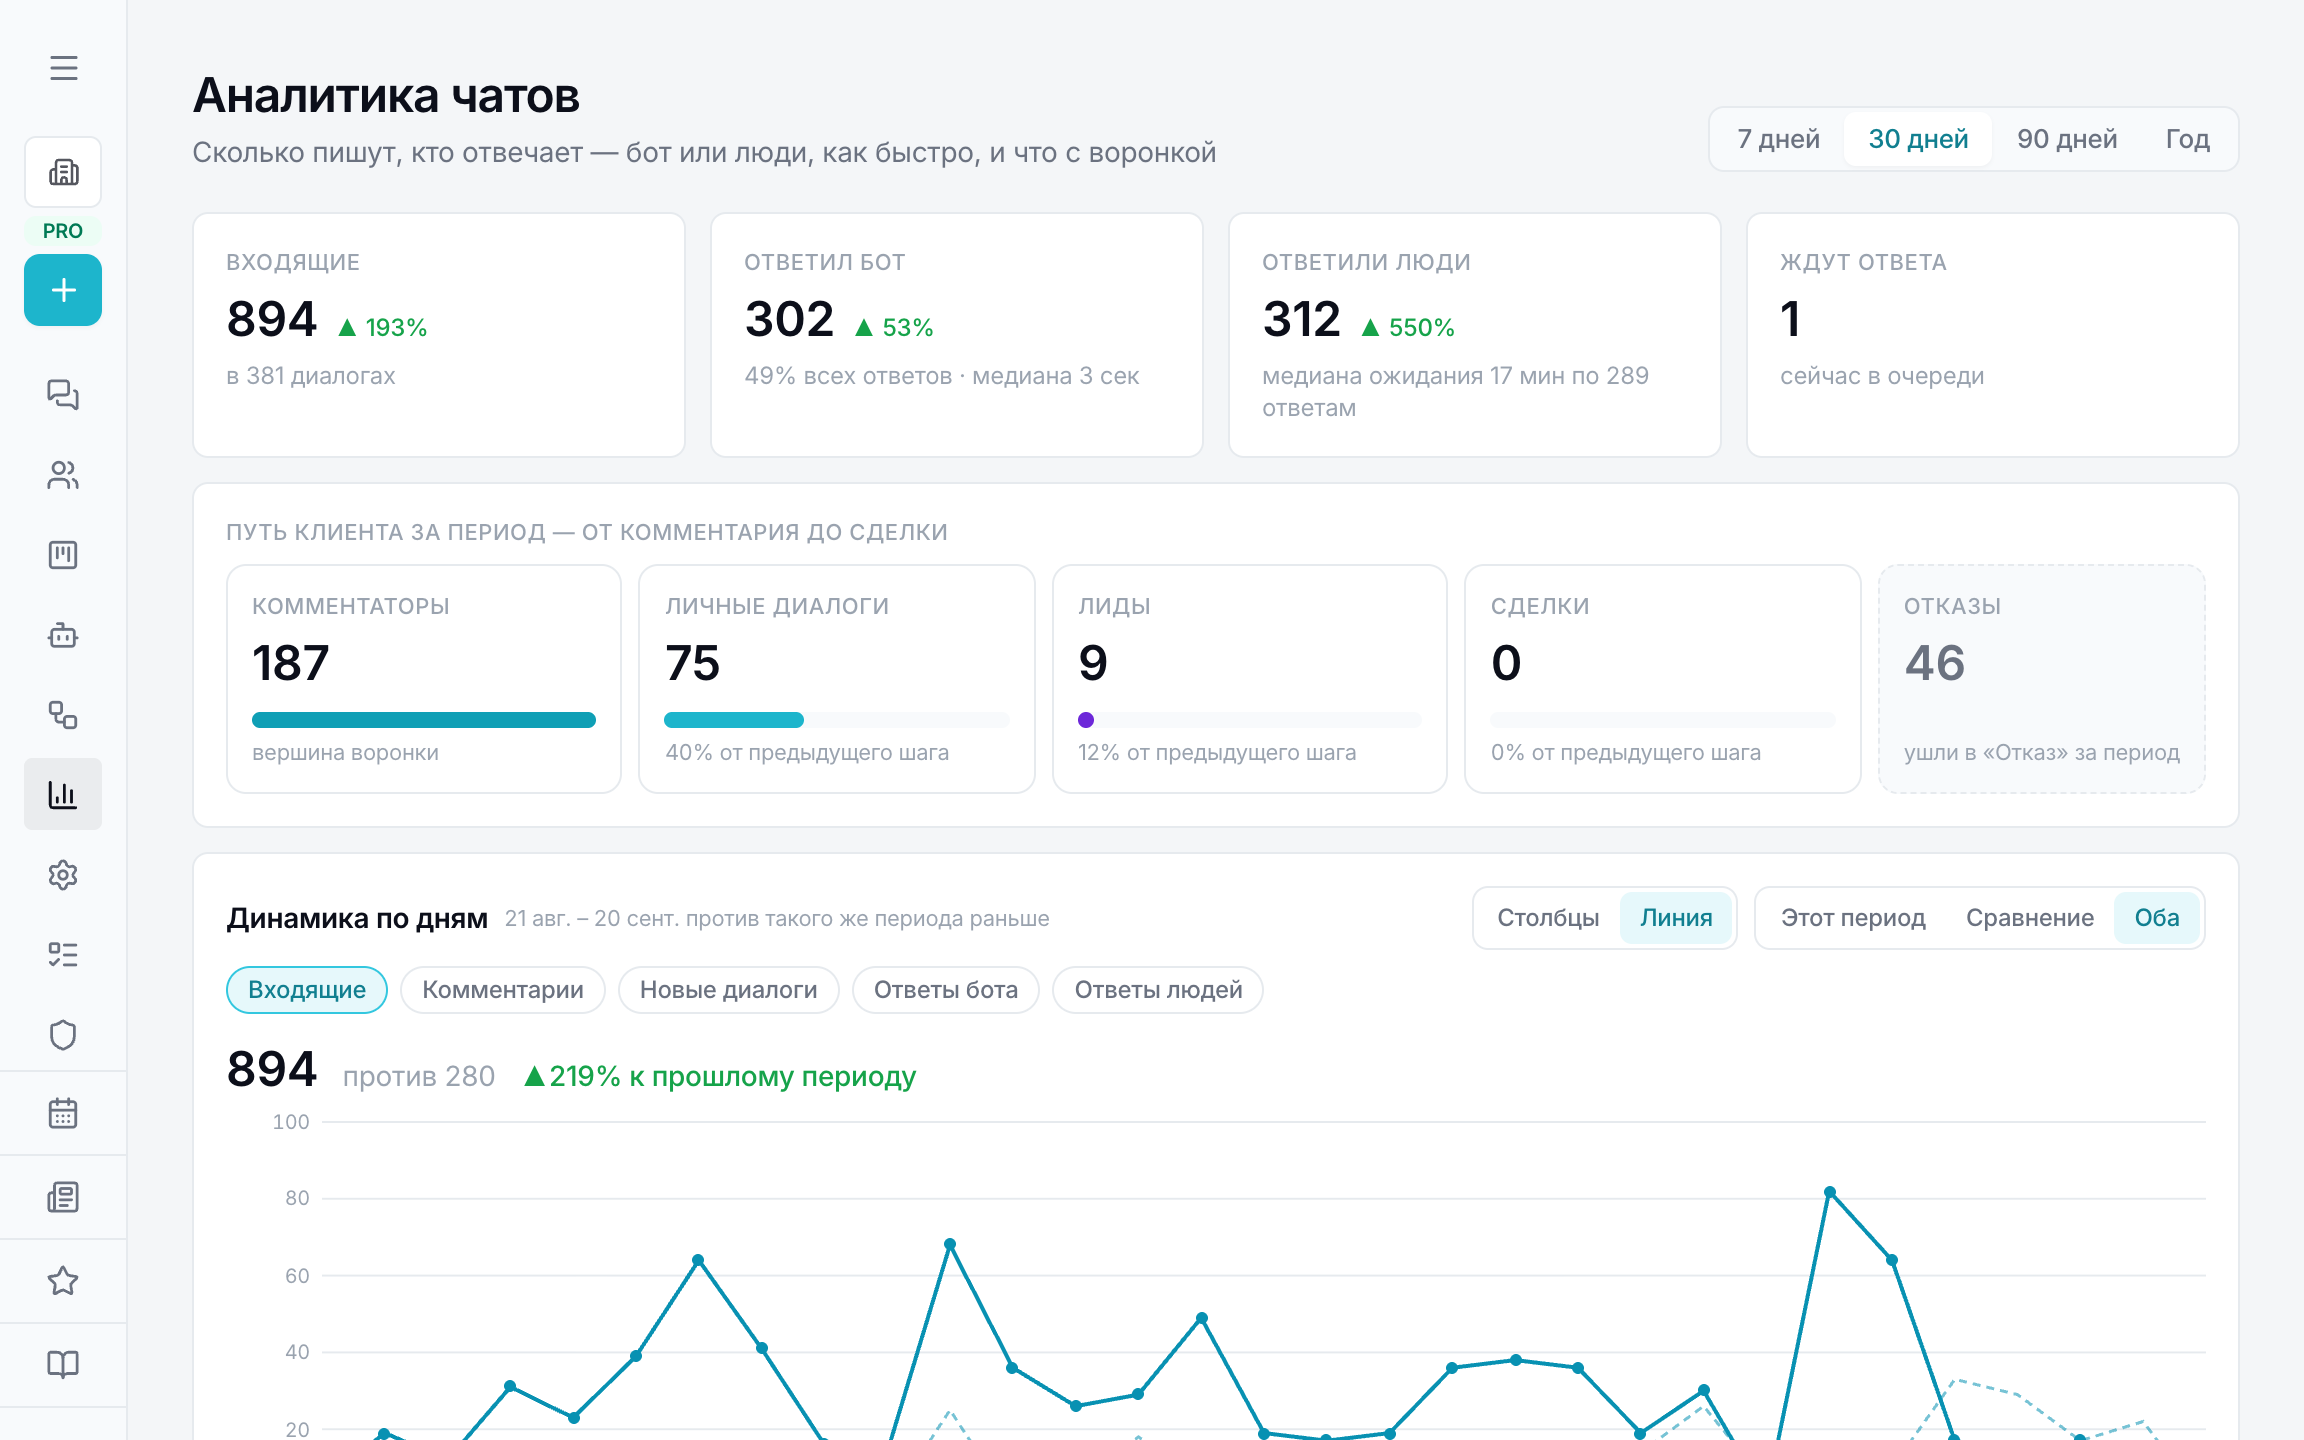
How to read
A bot's median reply in seconds against people's median in minutes isn't a reproach to people but an argument for giving the first reply to the bot: 80% of visitors leave without waiting a minute for a reply. If the “bot replied” share grows but “leads” don't, look at the agent's instructions: it replies but doesn't lead to the goal.